
A real estate bubble or property
bubble (or housing bubble for residential
markets) is a type of economic bubble
that occurs periodically in local or
global real estate markets. It is characterized
by rapid increases in valuations of
real property such as housing until
they reach unsustainable levels relative
to incomes and other economic elements.
As with any type of economic bubble, it is often claimed that a real estate bubble is difficult for many to identify except in hindsight, after the crash. The crash of the Japanese asset price bubble from 1990 on has been very damaging to the Japanese economy and the lives of many Japanese who have lived through it [1], as is also true of the recent crash of the real estate bubble in China's largest city, Shanghai [2]. Unlike a stock market crash following a bubble, a real-estate "crash" is usually a slower process, because the real estate market is less liquid than the stock market. Other sectors such as office, hotel and retail generally move along with the residential market, being affected by many of same variables (incomes, interest rates, etc.) and also sharing the "wealth effect" of booms. Therefore this article focuses on housing bubbles and mentions other sectors only when their situation differs from housing. |
As of 2007, real estate bubbles have existed in the recent past or are widely believed to still exist in many parts of the world, especially in the United States, Argentina, Britain, the Netherlands, Italy, Australia, New Zealand, Ireland, Spain, France, Poland, South Africa, Israel, Greece, Bulgaria, Croatia, Canada, Norway, Singapore, South Korea , Sweden, Baltic states, India, Romania, South Korea, Russia, Ukraine and China.[citation needed] U.S. Federal Reserve Chairman Alan Greenspan said in mid-2005 that "at a minimum, there's a little 'froth' (in the U.S. housing market) … it's hard not to see that there are a lot of local bubbles" [3]. The Economist magazine, writing at the same time, went further, saying "the worldwide rise in house prices is the biggest bubble in history".[4] Real estate bubbles are invariably followed by severe price decreases (also known as a house price crash) that can result in many owners holding negative equity (a mortgage debt higher than the current value of the property).
| Housing market indicators | ||
 |
|
|
| UK house prices between 1975 and 2006. | ||
 |
In attempting to identify bubbles before they burst, economists have developed a number of financial ratios and economic indicators that can be used to evaluate whether homes in a given area are fairly valued. By comparing current levels to previous levels that have proven unsustainable in the past (i.e. led to or at least accompanied crashes), one can make an educated guess as to whether a given real estate market is experiencing a bubble. Indicators describe two interwoven aspects of housing bubble: a valuation component and a debt (or leverage) component. The valuation component measures how expensive houses are relative to what most people can afford, and the debt component measures how indebted households become in buying them for home or profit (and also how much exposure the banks accumulate by lending for them). A basic summary of the progress of housing indicators for U.S. cities is provided by Business Week [5]. See also: real estate economics and real estate trends.
Housing affordability measures
- The price to income ratio is the basic affordability measure for housing in a given area. It is generally the ratio of median house prices to median familial disposable incomes, expressed as a percentage or as years of income. It is sometimes compiled separately for first time buyers and termed attainability. This ratio, applied to individuals, is a basic component of mortgage lending decisions. According to a back-of-the-envelope calculation by Goldman Sachs, a comparison of median home prices to median household income suggests that U.S. housing in 2005 is overvalued by 10%. "However, this estimate is based on an average mortgage rate of about 6%, and we expect rates to rise," the firm's economics team wrote in a recent report. According to Goldman's figures, a one-percentage-point rise in mortgage rates would reduce the fair value of home prices by 8%.
- The
deposit to income ratio is the
minimum required downpayment for a typical
mortgage, expressed in months or years
of income. It is especially important
for first-time buyers without existing
home equity; if the downpayment becomes
too high then those buyers may find themselves
"priced out" of the market. For example,
as of 2004 this ratio was equal to one
year of income in the UK (Nottingham Trent
University paper).
Another variant is what the National Association of Realtors calls the "housing affordability index" in its publications [6]. (The NAR's methodology was criticized by some analysts as it does not account for inflation [7]. Other analysts, however, consider the measure appropriate, because both the income and housing cost data is expressed in terms that include inflation and, all things being equal, the index implicitly includes inflation. In either case, the usefulness of this ratio in identifying a bubble is debatable; while downpayments normally increase with house valuations, bank lending becomes increasingly lax during a bubble and mortgages are offered to borrowers who would not normally qualify for them (see Housing debt measures, below).
- The Affordability Index measures the ratio of the actual monthly cost of the mortgage to take-home income. It is used more in the United Kingdom where nearly all mortgages are variable and pegged to bank lending rates. It offers a much more realistic measure of the ability of households to afford housing than the crude price to income ratio. However it is more difficult to calculate, and hence the price to income ratio is still more commonly used by pundits. In recent years, lending practices have relaxed, allowing greater multiples of income to be borrowed. Some speculate that this practice in the longterm cannot be sustained and may ultimately lead to unaffordable mortgage payments, and repossession for many.
- The Median Multiple measures the ratio of the median house price to the median annual household income. This measure has historically hovered around a value of 3.0 or less, but in recent years has risen dramatically, especially in markets with severe public policy constraints on land and development. The Demographia International Housing Affordability Survey uses the Median Multiple in its 6-nation report.
-
-
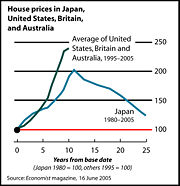
Inflation-adjusted home prices in Japan (1980-2005) compared to home price appreciation in the United States, Britain, and Australia (1995-2005).

Housing debt measures
- The housing debt to income ratio or debt-service ratio is the ratio of mortgage payments to disposable income. When the ratio gets too high, households become increasingly dependent on rising property values to service their debt. A variant of this indicator measures total home ownership costs, including mortgage payments, utilities and property taxes, as a percentage of a typical household's monthly pre-tax income; for example see RBC Economics' reports for the Canadian markets (June 2, 2005 report).
- The housing debt to equity ratio (not to be confused with the corporate debt to equity ratio), also called loan to value, is the ratio of the mortgage debt to the value of the underlying property; it measures financial leverage. This ratio increases when homeowners refinance and tap into their home equity through a second mortgage or home equity loan. A ratio of 1 means 100% leverage; higher than 1 means negative equity.
Housing ownership and rent measures
- The ownership ratio is the proportion of households who own their homes as opposed to renting. It tends to rise steadily with incomes. Also, governments often enact measures such as tax cuts or subsidized financing to encourage and facilitate home ownership. If a rise in ownership is not supported by a rise in incomes, it can mean either that buyers are taking advantage of low interest rates (which must eventually rise again as the economy heats up) or that home loans are awarded more liberally, to borrowers with poor credit. Therefore a high ownership ratio combined with an increased rate of subprime lending may signal higher debt levels associated with bubbles.
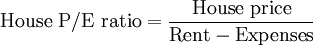
- The price-to-earnings ratio or P/E ratio is the common metric used to assess the relative valuation of equities. To compute the P/E ratio for the case of a rented house, divide the price of the house by its potential earnings or net income, which is the market rent of the house minus expenses, which include maintenance and property taxes. This formula is:
-
- The house price-to-earnings ratio provides a direct comparison to P/E ratios used to analyze other uses of the money tied up in a home. Compare this ratio to the simpler but less accurate price-rent ratio below.
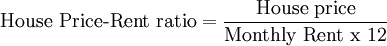
- The price-rent ratio is the average cost of ownership divided by the received rent income (if buying to let) or the estimated rent that would be paid if renting (if buying to reside):
-
- The latter is often measured using the "owner's equivalent rent" numbers published by the Bureau of Labor Statistics. It can be viewed as the real estate equivalent of stocks' price-earnings ratio; in other terms it measures how much the buyer is paying for each dollar of received rent income (or dollar saved from rent spending). Rents, just like corporate and personal incomes, are generally tied very closely to supply and demand fundamentals; one rarely sees an unsustainable "rent bubble" (or "income bubble" for that matter). Therefore a rapid increase of home prices combined with a flat renting market can signal the onset of a bubble. The U.S. price-rent ratio was 18% higher than its long-run average as of October 2004 (Federal Reserve Bank of San Francisco report).
- The gross rental yield, a measure used in the United Kingdom, is the total yearly gross rent divided by the house price and expressed as a percentage:
-
- This is the reciprocal of the house price-rent ratio. The net rental yield deducts the landlord's expenses (and sometimes estimated rental voids) from the gross rent before doing the above calculation; this is the reciprocal of the house P/E ratio.
- Because rents are received throughout the year rather than at its end, both the gross and net rental yields calculated by the above are somewhat less than the true rental yields obtained when taking into account the monthly nature of the rental payments. * The occupancy rate (opposite: vacancy rate) is the number of occupied units divided by the total number of units in a given region (in commercial real estate, it is usually expressed terms of area such as square meters for different grades of buildings). A low occupancy rate means that the market is in a state of oversupply brought about by speculative construction and purchase. In this context, supply-and-demand numbers can be misleading: sales demand exceeds supply, but rent demand does not.

Real estate bubbles in the 2000s
As of 2006, several areas of the world are thought by some to be in a bubble state, although the subject is highly controversial. this hypothesis is based on similar patterns in real estate markets of a wide variety of countries. This includes similar patterns of overvaluation and excessive borrowing based on those over-valuations.
Some economists maintain that there is not enough similarity to assert a world trend. Other assert that there are enough common characteristics to call it a broad pattern; the reasons for such a pattern can be attributed to any of a number of macroeconomic trends. One such trend might be the rapid growth of developing economic such as the BRIC group. this has caused significant growth in monetary reserves and savings in those countries, which in turn has made possible extension of credit elsewhere.
The subprime mortgage crisis, with its accompanying impacts and effects on economies in various nations, has given some credence to the idea that these trends might have some common characteristics.
For individual countries, see:
- British property bubble
- Bulgarian property bubble
- Chinese property bubble
- Danish property bubble
- Indian property bubble
- Irish property bubble
- Japanese asset price bubble
- Polish property bubble
- Romanian property bubble
- Russian property bubble
- South Korean property bubble
- Spanish property bubble
- United States housing bubble
References
- Barron's Magazine
- John Calverley (2004), Bubbles and how to survive them, N. Brealey.
- The Economist, December 8th, 2005, "Hear that hissing sound?."
- The Economist, June 16th, 2005, "After the fall."
- The Economist, June 16th, 2005, "In come the waves."
- The Economist, April 20th, 2005, "Will the walls come falling down?"
- The Economist, May 3d, 2005, "Still want to buy?"
- The Economist, May 29th, 2003, "House of cards."
- The Economist, May 28th, 2002, "Going through the roof."
- The New York Times, December 25th, 2005, Take It From Japan: Bubbles Hurt.
- Robert Kiyosaki (2005). All Booms Bust, Rich Dad, Poor Dad
- Burton G. Malkiel (2003). The Random Walk Guide to Investing: Ten Rules for Financial Success, New York: W. W. Norton and Company, Inc.
- Robert J. Shiller (2005). Irrational Exuberance, 2d ed. Princeton University Press.
- John R. Talbott (2003). The Coming Crash in the Housing Market, New York: McGraw-Hill, Inc
- Andrew Tobias (2005). The Only Investment Guide You'll Ever Need (updated ed.), Harcourt Brace and Company.
- Eric Tyson (2003). Personal Finance for Dummies, 4th ed., Foster City, CA: IDG Books.
- Benjamin Wallace-Wells, "There goes the neighborhood", Washington Monthly, 2004 April.
- Elizabeth Warren and Amelia Warren Tyagi (2003). The Two-Income Trap: Why Middle Class Mothers and Fathers are Going Broke, New York: Basic Books. ISBN 0-465-09082-6.
- Dean Baker, Financial Bubbles (Stocks and Housing) and How You Can Protect Yourself Against Them, Center for Economic and Policy Research Economics Seminar Series.
External links
- Center for Economic and Policy Research
- The bursting of the US house price bubblePDF (401 KiB) Article by Stéphane Sorbe, French Treasury, July 2008
- Is the Housing Bubble Collapsing? 10 Indicators to WatchPDF (153 KiB) Report by Dean Baker, June 2006
- When Bubbles BurstPDF (354 KiB), World Economic Outlook, International Monetary Fund, April 2003.
- The Global House Price BoomPDF (367 KiB), World Economic Outlook, International Monetary Fund, September 2004.
- California’s Real Estate Bubble by Fred E. Foldvary, covers the California, U.S., and global bubble from a libertarian perspective.
- Demographia International Housing Affordability Survey Comparative housing affordability for 100 large markets in the U.S., U.K., Canada, Australia, New Zealand and Ireland.
- Are housing prices, household debt, and growth sustainable?PDF (342 KiB), Levy Economics Institute of Bard College, January 2006.
- Are Real Estate Prices Dependent on Mortgage Rates? Article by Lucas Finco, Quadlet LLC April 2006
- Explaining Real Estate Price Bubbles by Roger J. Brown, The Wolfram Demonstrations Project; originally appeared in R. J. Brown, Private Real Estate Investment: Data Analysis and Decision Making, Burlington, MA: Elsevier Academic Press, 2005.
- Are Real Estate Prices Dependent on Mortgage Rates? Article by Lucas Finco, Quadlet LLC April 2006
- Bubble States and Bankruptcies A graph showing the increases in bankruptcy filings and foreclosures in 4 bubble states.
- Where should house prices really be and how did they get so high? 2008 Analysis of how the US Real Estate Bubble developed and where housing prices can be expected to head.
- "The Great Correction" Tracking the dramatic market adjustment in Southwestern California.
- Home Value Calculator Calculate a property's value based upon P/E Ratio - Upper and Lower limits.