What is Acceleration? Velocity vs. Acceleration
Definitions:
Speed or Velocity?
Speed is the rate of motion, or the rate of change of position. It is expressed as distance moved (d) per unit of time(t). Speed is a scalar quantity with dimensions distance/time. Speed is measured in the same physical units of measurement as velocity, but does not contain an element of direction. Speed is thus the magnitude component of velocity. Velocity contains both the magnitude and direction components.
Common speeds of moving objects
For human beings, an average walking speed is about 3 mph (~5 km/h, 1.39m/s),
The speed of long distance jogging for average persons is about 6 mph (~10 km/h, 2.7 m/s).
Top athletic sprinters can run at 23.03 mph (~36.85 km/h, 10.24 m/s) within a short distance such as a 200 meters dash.
Cycling can average 12 mph (~20 km/h, 5.56 m/s)
Car can average 65 mph (~104 km/h, 28.9 m/s ) on highway
A 747 Airplane has an average speed 565 mi/hr
Acceleration
Acceleration, (symbol: a) is defined as the rate of change of velocity. It is thus a vector quantity with dimension length/time². In SI units, acceleration is measured in meters/second².
To accelerate an object is to change its velocity, which is accomplished by altering either its speed or direction (like in case of uniform circular motion) in relation to time. Acceleration can have positive and negative values. Any time that the sign (+ or -) of the acceleration is the same as the sign of the velocity, the object will speed up. If the signs are opposite, the object will slow down. Acceleration is a vector quantity. When either velocity or direction changes, there is acceleration (or deceleration).
To accelerate an object requires the application of a force.
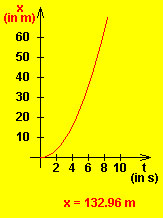
Graphing Velocity and Acceleration
A car accelerates from rest. The following two graphs are created using a java applet (see below).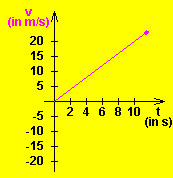
Please enter your answer in the space provided:
Create your own graphs for accelerating objects using the following java applet: This HTML5 app by Walter Fendt shows a car moving with constant acceleration. The green control panel contains text fields where you can vary the values of initial position, initial velocity and acceleration (don't forget to press the "Enter" key!). By using the buttons at the top right you can bring the car back to its initial position or stop and resume the simulation. If you choose the option "Slow motion", the movement will be ten times slower.
Force, Work and Energy
Speed, Velocity and Acceleration: What is the difference between speed and velocity? What is acceleration? Graphing Velocity and Acceleration. Testing your understanding.
Force: What is force? Measuring forces. Describing Forces. What does a force do? What is friction? Assessment Questions.
Vectors and Scalars: What is a vector quantity? Examples of Vectors. What is a Scalar Quantity? Examples of Scalars. Test your understanding of vectors and scalars.
Newtons Three Laws of Motion: See Newton's Three Laws in Latin and the English translation. Examples for each law are given..
Work, Energy and Power: Definitions for work, energy and power. Types of energy, calculating work, and power.
Difference between Mass and Weight: Great page for gifted and talented students! Some excellent challenging problems.
Gravity, Mass and Weight: Gravity, mass and weight in relation to the Solar System
Basic and Derived Units: Basic and derived units including , physical quantities, symbols for units of measure.
Mathematical Relationships in Science: See Lab 5, Acceleration.