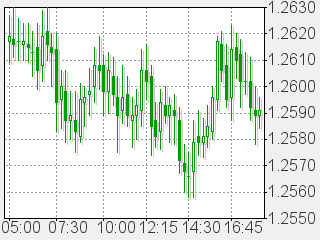
A candlestick
chart is a style of bar-chart used primarily to describe price
movements of an equity over time.
It is a combination
of a line-chart and a bar-chart, in that each bar represents the
range of price movement over a given time interval. It is most
often used in technical analysis of equity and currency price
patterns. They appear superficially similar to error bars, but
are unrelated.
History
Candlestick
charts are said to have been developed in the 18th century
by legendary Japanese rice trader Homma Munehisa. The charts gave
Homma and others an overview of open, high, low, and close market
prices over a certain period. This style of charting is very popular
due to the level of ease in reading and understanding the graphs.
Since the 17th century, there has been a lot of effort to relate
chart patterns to the likely future behavior of a market. This
method of charting prices proved to be particularly interesting,
due to the ability to display five data points instead of one.
The Japanese rice traders also found that the resulting charts
would provide a fairly reliable tool to predict future demand.
Steve Nison's
1991 book, Japanese Candlestick Charting Techniques (ISBN
0-7352-0181-1), called back into traders' memory this particular
form of charting, which
had already been picked up by Charles Dow around 1900. Today it
is one of the most commonly used chart displaying methods with
traders.
Candlestick
layout
Candlesticks
are usually composed of the body (black or white), an upper and
a lower shadow (wick). The wick illustrates the highest and lowest
traded prices of a stock, and the body the opening and closing
trades. If the stock went up, the body is white, with the opening
price at the bottom of the body and the closing price at the top.
If the stock went down, the body is black, with the opening price
at the top and the closing price at the bottom. A candlestick
need not have either a body or a wick.
Patterns
Simple
Patterns
There are
multiple forms of candlestick chart patterns, with the simplest
depicted at right. Here is a quick overview of their names:

- White candlestick
- signals uptrend movement (those occur in different lengths;
the longer the body, the more significant the price increase)
- Black candlestick
- signals downtrend movement (those occur in different lengths;
the longer the body, the more significant the price decrease)
- Long lower
shadow - bullish signal (the lower wick must be at least the
body's size; the longer the lower wick, the more reliable the
signal)
- Long
upper shadow - bearish signal (the upper wick must be at
least the body's size; the longer the upper wick, the more reliable
the signal)
- Hammer
- a bullish pattern during a downtrend (long lower wick and
small or no body); Shaven head - a bullish pattern during a
downtrend & a bearish pattern during an uptrend (no upper
wick); Hanging man - bearish pattern during an uptrend (long
lower wick, small or no body; wick has the multiple length of
the body.
- Inverted
hammer - signals bottom reversal, however confirmation must
be obtained from next trade (may be either a white or black
body); Shaven bottom - signaling bottom reversal, however confirmation
must be obtained from next trade (no lower wick); Shooting star
- a bearish pattern during an uptrend (small body, long upper
wick, small or no lower wick)
- Spinning
top white - neutral pattern, meaningful in combination with
other candlestick patterns
- Spinning
top black - neutral pattern, meaningful in combination with
other candlestick patterns
- Doji -
neutral pattern, meaningful in combination with other candlestick
patterns
- Long legged
doji - signals a top reversal
- Dragonfly
doji - signals trend reversal (no upper wick, long lower wick)
- Gravestone
doji - signals trend reversal (no lower wick, long upper wick)
- Marubozu
white - dominant bullish trades, continued bullish trend (no
upper, no lower wick)
- Marubozu
black - dominant bearish trades, continued bearish trend (no
upper, no lower wick)
Complex
Patterns
Despite those
rather simple patterns depicted in the section above, there are
more complex and difficult patterns, which have been identified
since the charting method's inception.
Candlestick
charts also convey more information than other forms of charts,
such as bar charts. Just as with bar charts, they display the
absolute values of the open, high, low, and closing price for
a given period. But, they also show how those prices are relative
to the prior periods prices, so one can tell by looking at one
bar if the price action is higher or lower than the prior one.
That and they are visually easier to look at, and can be colorized
for even better definition.
Use
of candlestick charts
Candlestick
charts are a visual aid for decision making in stock, forex, commodity,
and options trading. For example, when the bar is white and high
relative to other time periods, it means buyers are very bullish.
The opposite is true for a black bar.
External
links
|