The random
walk hypothesis is a financial theory stating that stock market
prices evolve according to a random walk and thus the prices of
the stock market cannot be predicted. It has been described as
'jibing' with the efficient
market hypothesis. Investors, economists, and other financial
behaviorists have historically accepted the random walk hypothesis.
They have run several tests and continue to believe that stock
prices are completely random because of the efficiency of the
market.
The term was
popularized by the 1973 book, A Random Walk Down Wall Street,
by Burton Malkiel, currently a Professor of Economics and Finance
at Princeton University.
Testing
the hypothesis
Burton G.
Malkiel, an economist professor at Princeton University and writer
of A Random Walk Down Wall Street, performed a test where
his students were given a hypothetical stock that was initially
worth fifty dollars. The closing stock price for each day was
determined by a coin flip. If the result was heads, the price
would close a half point higher, but if the result was tails,
it would close a half point lower. Thus, each time, the price
had a fifty-fifty chance of closing higher or lower than the previous
day. Cycles or trends were determined from the tests. Malkiel
then took the results in a chart and graph form to a chartist
(a person who seeks to predict future movements by seeking to
interpret past patterns on the assumption that history tends to
repeat itself) (Keane 11). The chartist told Malkiel that they
needed to immediately buy the stock. When Malkiel told him it
was based purely on flipping a coin, the chartist was very unhappy.
This indicates that the market and stocks could be just as random
as flipping a coin.
The random
walk hypothesis was also applied to NBA basketball. Psychologists
made a detailed study of every shot the Philadelphia 76ers made
over one and one-half seasons of basketball. The psychologists
found no positive correlation between the previous shots and the
outcomes of the shots afterwards. Economists and believers in
the random walk hypothesis apply this to the stock market. The
actual lack of correlation of past and present can be easily seen.
If a stock goes up one day, no stock market participant can accurately
predict that it will rise again the next. Just as a basketball
player with the hot hand can miss his or her next shot, the stock
that seems to be on the rise can fall at any time, making it completely
random.
A
non-random walk hypothesis
There are
other economists, professors, and investors who believe that the
market is predictable to some degree. The people believe that
there are trends and incremental changes in the prices and when
looking at them, one can determine whether the stock is on the
rise or fall. There have been key studies done by economists and
a book has been written by two professors of economics that try
to prove the random walk hypothesis wrong.
Martin Weber,
a leading researcher in behavioral finance, has done many tests
and studies on finding trends in the stock market. In one of his
key studies, he observed the stock market for ten years. Over
those ten years, he looked at the market prices and looked for
any kind of trends. He found that stocks with high price increases
in the first five years tended to become under-performers in the
following five years. Weber and other believers in the non-random
walk hypothesis cite this as a key contributor and contradictor
to the random walk hypothesis.
Another test
that Weber ran that contradicts the random walk hypothesis was
finding stocks that have had an upward revision for earnings outperform
other stocks in the forthcoming six months. With this knowledge,
investors can have an edge in predicting what stocks to pull out
of the market and which stocks the stocks with the upward revision
to leave in. Martin Weber™s studies detract from the random walk
hypothesis, because according to Weber there are trends and other
tips to predicting the stock market.
Professors
Andrew W. Lo and A. Craig MacKinlay, professors of Finance at
the MIT Sloan School of Management and the University of Pennsylvania,
respectively, have also tried to prove the random walk theory
wrong. They wrote the book A Non-Random Walk Down Wall Street,
which goes through a number of tests and studies that try to prove
there are trends in the stock market and that they are somewhat
predictable. They try to prove it with what is called the simple
volatility-based specification test, which is an equation that
states:
They prove
it with what is called the simple volatility-based specification
test, which is an equation that states:
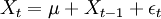
where
- Xt
is the price of the stock at time t
- ÎĽ
is an arbitrary drift parameter
- εt
is a random disturbance term.
With this
equation, they have been able to put in stock prices over the
last number of years, and figure out the trends that have unfolded
(Non-Random 19). They have found small incremental changes in
the stocks throughout the years. Through these changes, Lo and
MacKinlay believe that the stock market is predictable, thus contradicting
the random walk hypothesis.
Random
walk hypothesis vs. market trends
The hypothesis
does have its detractors. Research in behavioral finance has shown
that some phenomena, for example market trends, might in some
cases contradict that hypothesis.
Profs. Andrew
W. Lo of MIT and A. Craig MacKinlay set about to prove the theory
wrong with their paper and synonymous book, A Non-Random Walk
Down Wall St., published in 1999 by the Princeton University
Press. They argue that the random walk does not exist and that
even the casual observer can look at the many stock and index
charts generated over the years and see the trends. If the market
were random, it is argued, there would never be the many long
rises and declines so clearly evident in those charts. Subscribers
to the random walk hypothesis counter-argue that past performance
cannot be indicative of future performance in a semi-strong market
economy.
Prediction
Company, started by chaos physicists Norman Packard and Doyne
Farmer, has been attempting to predict the stock market since
1991. So far, they have proved moderately successful.[1]
References
- Bass,
Thomas A., The Predictors, 1999, Henry Holt Publishing,
p. 138
- Fromlet,
Hubert. Behavioral Finance-Theory and Practical Application.
Business Economics July 2001: 63.
- Keane,
Simon M. Stock Market Efficiency. Oxford: Philip Allan
Limited, 1983.
- Lo, Andrew
W., and A. C. Mackinlay. A Non-Random Walk Down Wall Street.
5th ed. Princeton: Princeton University P, 2002. 4-47.
- Malkiel,
Burton G. A Random Walk Down Wall Street. 6th ed. New
York: W.W. Norton & Company, Inc., 1973.
|